


# CEO dashboard: the board that warns you before margin breaks
Seven ‘few but decisive’ metrics for project businesses.
I don’t need a “pretty” dashboard. I need one that tells me the truth early.
In project businesses (sell + design + produce + install), margin rarely breaks overnight. It breaks quietly first: promises that don’t match capacity, changes that slip in without ownership, incidents that become “normal,” cash trapped in work-in-progress that nobody sees because revenue sounds good.
This is not a BI manual. No templates, no formulas, no step-by-step. I’m sharing my lens: seven metrics that turn a dashboard into governance.
## Why most dashboards don’t protect margin
They usually fail because they measure late, measure without ownership, or become KPI theatre. If a metric doesn’t trigger a real conversation with clear decision rights, it’s decoration.
## What makes it a CEO dashboard
It must connect promise to reality: what I sell, what I can execute, what it costs, and what drains cash. When that connection exists, I get early warnings.
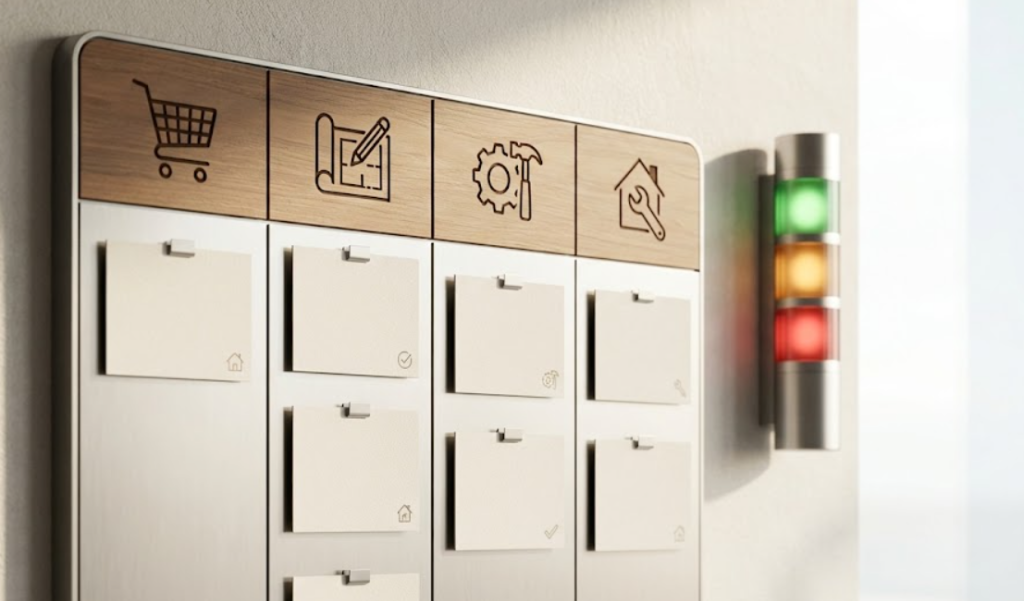
## The seven metrics I want to see (and why)
### 1) Committed margin vs defendable margin
Committed margin is what I implicitly promise at close. Defendable margin is what my operation can actually sustain. When the gap grows, margin is already broken—just not yet visible in accounting.
Questions I ask: What part of margin depends on post-signature decisions? Where am I “selling stability” without pricing the exposure? Who owns quote coherence?
### 2) Backlog health by stage
Backlog is a queue with states, not a single number. I want to see where flow stalls and which stage is becoming the real bottleneck.
Questions: Which stage determines my real promise date? Where is healthy work vs waiting disguised as progress?
### 3) Variability and exceptions (governed changes vs unmanaged changes)
Variability kills when it enters without governance. I want to see the difference between explicit decisions and changes that “sneak in” as favors, urgency, or habit.
Questions: Which changes are customer-driven vs internal rework? Who decides equivalence under substitution? What repeats?
### 4) Cost of poor quality (COPQ) as operational signals
I don’t want “quality talk.” I want to see whether non-quality is growing and where it’s injected: install issues, rework, remakes, small fixes that consume schedule and indirect hours.
Risk: if you punish reporting, you can “improve” the number while damage grows.
### 5) Promise reliability (promised lead time vs delivered lead time)
In high-ticket projects, lead time is part of the product. Reliability reveals coordination, materials discipline, change control, and real capacity—not wishful thinking.
### 6) Cash trapped in WIP, buffers, and unfinished closures
I’ve seen “profitable” companies suffocating because cash is trapped: producing before conditions are closed, buying “just in case,” finishing “almost” but not closing, chasing paperwork instead of having a system.
Questions: What blocks final closure and final cash? Where is working capital really decided—sales, purchasing, or installation?

### 7) Pipeline quality: conversion with aging (not just “opportunities”)
A full pipeline isn’t health if it ages badly. I look at flow of decisions, re-quoting, “no” reasons, and how often deals close with hidden exposure.
## How I use the dashboard (without bureaucracy)
It works only if it forces the right conversations, creates a shared language across sales/ops/finance, and reveals patterns. If it becomes a museum of charts, I’d rather not have it.
## Closing
A CEO dashboard isn’t software. It’s governance: few signals, high clarity, decisions early.
Diagnóstico express